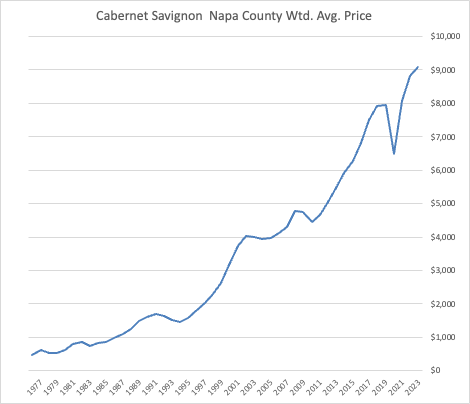
NAPA VALLEY, Calif. — The recently released Preliminary 2023 California Grape Crush Report reveals soaring grape prices in Napa Valley. Exploring further, other reports flash warning signs and reveal conflicting trajectories: While grape prices, particularly for premium varieties such as cabernet sauvignon, are skyrocketing, there's a notable decline in demand for the wines produced from these expensive grapes. Given these contrasting indicators, it becomes increasingly crucial to determine if this continued surge in grape prices represents lasting growth or a bubble on the verge of bursting.
The 2023 Preliminary Crush Report
The report reveals a year-on-year statewide increase in grape-crush volume by 1.6%, totaling 3,728,923 tons. Red wine grape volume grew by 2.3% to 1,959,024 tons, and white wine grape volume jumped by 15.3% to 1,709,270 tons.
Statewide, the average price per ton for all grape varieties increased by 11.4%, reaching $1,038.97. Red wine grapes experienced a more significant average price increase of 13.6%, reaching $1,346.13 per ton, while white wine grapes rose by 6.4%, averaging $733.33 per ton. Chardonnay and cabernet sauvignon continued to lead, accounting for 17.5% and 17.3% of the total crush, respectively.
Although consumers have historically been willing to pay a premium for Napa Valley wines, this advantage might turn into a vulnerability if the industry faces intensifying pricing challenges.
In Napa Valley (District 4) the average price per ton was the highest in California at $6,943.33, a 3.7% increase from the previous year. By contrast, District 3, which includes Sonoma and Marin counties, had the second-highest average price at $2,915.82 per ton. The average price for Napa Valley cabernet sauvignon reached a record $9,079 per ton.
Looking back at the 2022 Crush Report data also shows a marked increase in the average price of Napa Valley cabernet sauvignon grapes to $8,813.38 per ton, up 11.6% from the prior year 2021.

The significant price difference between average wine grape prices in Sonoma County and Napa County amounts to nearly a 140% disparity. This gap is particularly striking given the close proximity of these two regions. While the “Napa Valley Premium Price” provides certain advantages, it could also pose risks under shifting market dynamics and pricing pressures in the wine industry. Although consumers have historically been willing to pay a premium for Napa Valley wines, this advantage might turn into a vulnerability if the industry faces intensifying competition, slowing demand and pricing challenges.

The 2023 report shows signs of market overheating. Extraordinary outliers, such as an anonymous buyer paying $67,200 for 7.1 tons of Napa Valley cabernet sauvignon and another paying $62,825 for 6 tons, underscore concerns about market speculation. These astronomical prices, possibly a result of 10% bottle-pricing methodologies, creative accounting or novel marketing strategies, nonetheless set new record highs, surpassing last year's record of $60,000 per ton max price. Conversely, substantial quantities of Napa Valley cabernet sauvignon were sold at more “affordable” prices, such as 2,499 tons at $6,500 per ton and 2,049 tons at $6,086 per ton, reflecting a market with diverse budgets and consumer segment strategies.

Note: Outliers (orange dots) were detected using Z-score analysis. The Z-score measures the number of standard deviations a data point is from the mean of the dataset. A common practice is to consider data points with a Z-score greater than +3 or less than -3 as outliers, suggesting that these points are markedly different from the rest of the data.
Applying Z-score analysis to the 2023 Napa Valley cabernet sauvignon data, several outliers were identified. For instance, entries such as $52,500 for 30 tons and $67,200 for 7.1 tons were outliers in terms of dollars per ton. In terms of tonnage, entries such as 2049.5 tons, 2499.3 tons and 1457.7 tons were well beyond the typical range.
Two different weighted averages for dollars per ton were calculated: one including all data points and another excluding the identified outliers. The weighted average is a mean where each data point contributes proportionally to the final average, with its contribution being scaled by its associated weight — in this case the tonnage of grapes.
The initial weighted average, which included all data points, was approximately $9,079 (consistent with the reported figure). This average considers the influence of all entries. Outliers, especially those with large tonnage but lower prices, pull this average down because their substantial weight (tonnage) has a greater influence on the calculation.
Removing the outliers based on the Z-score analysis, the weighted average actually increased to approximately $9,268. This increase, counterintuitive at first glance, occurs because the removed outliers had a dampening effect on the average due to their large weights combined with lower dollar values. With these outliers removed, the remaining data points, which have higher dollar values on average, carry more weight in the calculation, pushing the average upward.
Beyond the Crush Report
Beyond the escalating grape prices highlighted in the 2023 crush report, additional data indicate a slowdown in consumer demand. A recent Sovos ShipCompliant report reveals a decline in both volume and value of direct-to-consumer shipments of Napa cabernet sauvignon in 2023. This trend suggests a potential misalignment between the high valuations of wine grapes and the prevailing market demand, pointing toward shifting consumer preferences or market saturation.

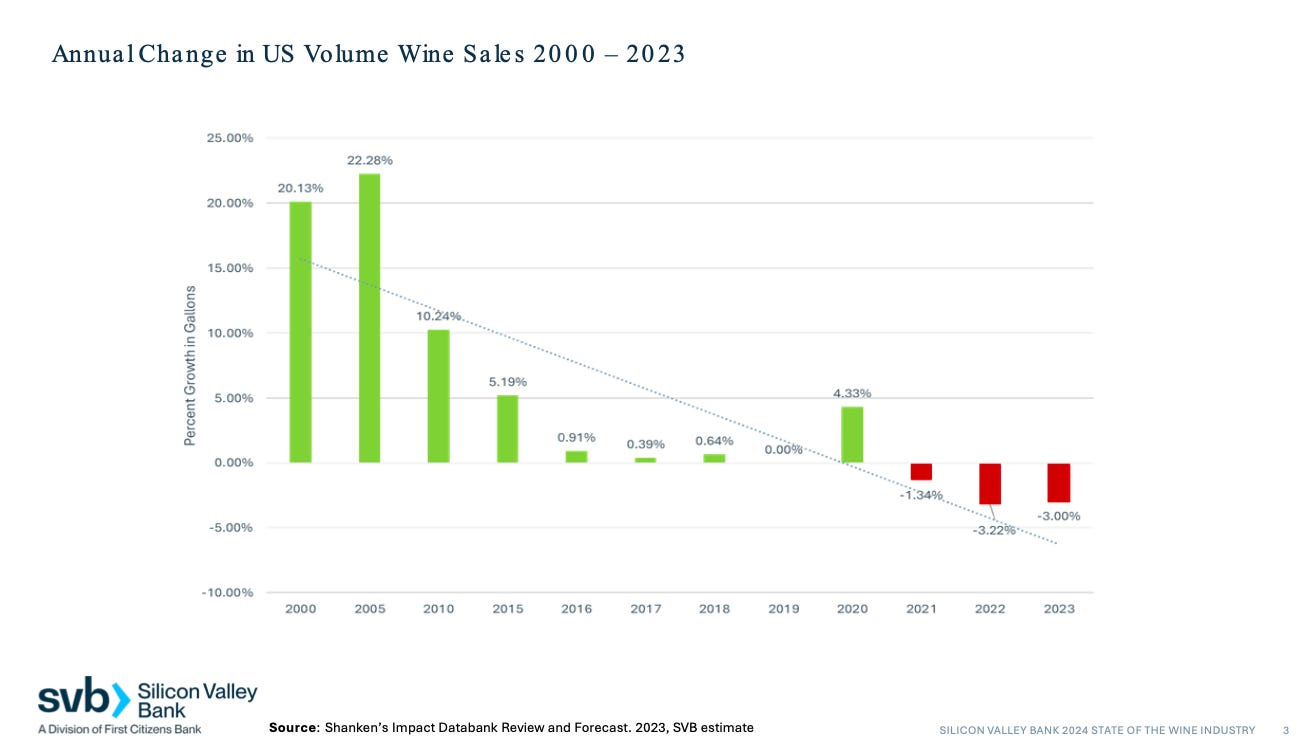
And a decrease in direct-to-consumer shipments is not the only challenge facing the wine industry. Broader forces are also having an impact, resulting in rising wine inventories, slowing sales and fewer tasting-room visits. Additional factors such as shifting consumer preferences, economic challenges and increasing global competition could further destabilize the market. The recent Silicon Valley Bank's "State of the U.S. Wine Industry 2024" report shows slowing growth in wine sales.

Conclusion
The trajectory of Napa Valley's grape prices has been meteoric, symbolizing a remarkable ascent in value. Yet, like all rapidly ascending growth curves, this pattern hints at volatility. While the rapid escalation in Napa Valley's grape prices underscores growth, it also signals potential instability. The 2023 Preliminary Grape Crush Report reveals a tension between market prosperity and speculative risk, underscored by surging prices, a bifurcated market and waning consumer demand. The coming years will be critical in determining whether the current valuation trends are a harbinger of continued prosperity or an economic aberration poised for correction.
If today's story captured your interest, explore these related articles:
Tim Carl is a Napa Valley-based photojournalist.


I bet it has to do with the winery definition ordinance which requires 85% Napa grapes in a bottle labeled Napa. There are so many new wineries needing Napa grapes and production maybe hasn't really expanded in a long time, haven't kept up with it but I don't think there have been a lot of new vineyards. So what you have is a supply crunch at the same time actual sales are going down. That would also mean bottles sitting in storage.
Always interesting to read about and follow the trends. While it, due to the 18-24 months process of Red winemaking, may be difficult or impossible to correctly correlate grape pricing to shipment volume/market value, I’m guessing the 5.7% and 5.3% declines in volume/value is relating to the (smaller) 2021-vintage?