Support Independent Local News:
Napa Valley Features depends on paid subscriptions to keep doing this work. We know this is a difficult time for many, but strong local news and information is more important than ever. As we continue the mission of Napa Valley Features, we are also building new tools and community resources that readers can explore at NapaServe.org. Please consider becoming a paid subscriber, renewing your subscription or joining as a founding member. In May, we enter our fourth year, and we could not do it without your support.
The Spotlight:
Welcome to Under the Hood, our exclusive weekly series for Napa Valley Features paid subscribers.
Summary of Today’s Article: Napa County’s public K-12 enrollment rose by 16 students over two years to 18,588 in 2025-26, a near-zero change that stands out in a North Bay region where most counties declined. But the stability is concentrated in Napa Valley Unified’s massive base while St. Helena’s growth is offset by losses in smaller Upvalley districts and a specialized enrollment bump at the Napa County Office of Education. Strip out NCOE and the county’s unified and elementary districts collectively slipped by 39 students, turning a headline gain into a modest organic decline. Beneath the flat line, the sharper story is a two-year drop of 574 English Learner students alongside a 590-student rise in non-EL enrollment, against a birth pipeline that has fallen by more than a third since the mid-2000s.
NEW:
This edition of Under the Hood is also published at NapaServe — Napa Valley Features' new community intelligence platform for Napa County. The interactive version includes hover-enabled data charts, links to a GDP-impact calculator for modeling the economic scenarios and additional reader polls. The site also features interactive dashboards and archive and event search. Read the interactive edition of today’s article here.
Beyond today’s discussion, we’re also digging into the latest results from our reader polls and pulling a few takeaways from our local economic dashboard.
You’ll also find a few recurring features in this edition: “What We’re Reading,” brief excerpts from recent articles offering a range of perspectives, and “Visuals That Caught Our Eye,” a closing roundup of standout charts and graphs from the week.
“What We’re Reading” — Excerpts of the Day:
Napa Valley cannabis-infused wine producer House of Saka filed for bankruptcy after reporting up to $500,000 in liabilities, marking another collapse in the region’s struggling cannabis beverage sector. – in "Napa's first cannabis-infused rosé maker files for bankruptcy," San Francisco Business Times.
“...this renovated facility has now been expanded so significantly that it now is large enough to hold massive crowds without difficulty, offering both indoor and outdoor experiences.” – from Dan Berger, in "Wine Chronicles: Mondavi’s Reopening Bets Big on Luxury and Scale," Napa Valley Features.
“What we can see in the 2025 data is a sector that's reacting to real-time impacts of U.S. tariff policies, but also adapting to some longer-term changes in terms of climate and consumption.” – from John Barker, in "US tariffs weigh on world wine trade in 2025 while consumption slips to new low," Reuters.
“It hurt the community. And it wasn’t his money. He took it from people who trusted him.” – from Josette Brose-Eichar, in "‘He’s still living in a mansion’: Collapse of a Wine Country real estate empire has left deep scars," San Francisco Chronicle.
“Many of today’s consumers don’t necessarily want technically clean, consistent products that fit neatly into market expectations.” – from Randy Caparoso, in "OpEd: What Wine Trends Tell Us About Market Opportunities," Wine Industry Advisor.
“It’s a really difficult transitional period for our region.” – from Carlton McCoy, in "For $200, you can finally taste the wines from Napa’s most revered Chardonnay vineyard," San Francisco Chronicle.
“For Iran, the Clock is Ticking, and they better get moving, FAST, or there won’t be anything left of them. TIME IS OF THE ESSENCE!” – from Donald Trump, in "UAE reports drone strike at nuclear power plant as Iran war deadlock persists," Reuters.
“With global oil inventories already drawing at a record clip, further price volatility appears likely ahead of the peak summer demand period.” – from the International Energy Agency, in "Plugging the gap," IEA Oil Market Report.
“It’s diesel that really runs the economy, and kind of runs the world.” – from Joe DeLaura, in "The US keeps talking about gas prices — but it’s diesel costs that could impact your life the most," The Independent.
“This move will reduce imports and tighten supplies in the local market.” – from Chirag Thakkar, in "India restricts most silver imports to cut import bill, support rupee," Reuters.

Napa County's Schools Held Flat. Three Different Stories Made the Number.
by Tim Carl
NAPA VALLEY, Calif. — Napa County’s public K-12 enrollment edged up 16 students over two years to 18,588 in 2025-26, according to California Department of Education Census Day data released April 16. The 0.09% change places Napa second in the immediate North Bay after Lake County (+0.62%) and just barely on the gain side of a regional line where most neighbors are losing ground. Marin recorded the steepest decline at -2.43%, Solano lost -0.96% and Mendocino lost -1.61%. Sonoma’s reported +0.34% reverses to -0.19% after subtracting the Liberty Elementary School District, a Petaluma-based charter authorizer whose count includes statewide virtual students.
The Napa headline is real. But it rests on a specific arithmetic. One large district held the line. One small Upvalley district added meaningfully. Three small Upvalley districts lost ground. The County Office of Education added a specialized population that lifts the topline. Underneath those moving parts, the composition of who is enrolled in Napa County schools has shifted measurably — and the input variable that will feed every district’s 2030 classrooms has been contracting for two decades across the entire North Bay, with Napa County out in front.

The Headline Is Real. The Stability Is Concentrated.
Napa Valley Unified School District enrolls 16,381 students — 88% of the county total. Over two years its net change was -12 students, a 0.07% decline that registers as measurement noise on a base that size. Whatever the county number does, NVUSD’s number is what drives it.
The Napa County Office of Education added 55 students over two years, from a base of 145 to 200. NCOE serves a specialized population — court schools, special education programs, alternative settings — and its enrollment changes reflect placement decisions and program capacity rather than organic family growth. The +55 figure is meaningful for the county headline but does not directly compare to the unified districts; the section below on the ex-NCOE adjustment treats it separately.

St. Helena Unified is the most interesting positive number in the Napa data. The district went from 1,103 students in 2023-24 to 1,152 in 2025-26, a gain of 49 students or 4.44% — the only Napa unified district above 300 students that grew meaningfully. St. Helena is a small, wealthy Upvalley district with a long-standing reputation for academic strength and competitive teacher compensation. In a county and a region where most districts are contracting, families with means are choosing to enroll their children there. The same dynamic shows up in the private sector: Justin-Siena High School in Napa, the county’s largest private school, grew from 541 students in 2019-20 to 679 in 2024-25 — a 25% gain (California Private School Affidavit data) over the same window in which most public districts contracted.
The other Napa districts moved against the headline. Calistoga Joint Unified fell from 790 to 748, a two-year loss of 42 students or 5.32% — the largest absolute decline in the county and the only loss occurring at a district that crosses the 700-student threshold where percentage changes translate into staffing pressures. Howell Mountain Elementary went from 93 to 77 (-17.20%). Pope Valley Union Elementary fell from 48 to 30 (-37.50%). Both are small-base districts where a swing of a few families produces a swing of several percentage points.

The Birth Curve Underneath
The Napa enrollment number is an effect, not a cause. Annual live births to Napa County residents peaked at 1,754 in 2006 and have fallen to 1,098 in 2024, a 37% decline over 18 years, according to California Department of Public Health Live Birth Profiles by County data. The drop continued to steepen after 2017: The county recorded 1,407 births in 2016, 1,291 in 2017 and 1,201 in 2018. Births have remained in a narrow range between 1,098 and 1,294 since 2018, suggesting a new lower band rather than an ongoing decline.
The pattern is regional, with Napa at the steep end of a narrow band. Sonoma County births peaked at 5,964 in 2004 and reached 4,347 in 2024, a 27.1% decline. Marin County births peaked at 2,865 in 2001 and reached 2,056 in 2024, a 28.2% decline. Napa’s 37.4% peak-to-2024 decline is the steepest of the three counties, but the gap to its neighbors is narrower than a Napa-only framing would suggest. The entire immediate North Bay has experienced a sustained contraction in family formation over the past two decades.
The cohort math matters for enrollment forecasting. The cohort entering kindergarten in 2029 will be the cohort born in 2024 — roughly 1,098 Napa children. The cohort that filled kindergartens in 2014 was the 2009 birth cohort, 1,653 children. The difference is 555 children, a 34% smaller incoming class spread across all six Napa districts. The input variable — the children being born — is contracting across the entire region.


What the Flat Line Looks Like Without the County Office of Education
The +55 students at the Napa County Office of Education contribute meaningfully to the county headline. Subtracting that specialized population from both endpoints clarifies what the unified districts collectively did.
Without NCOE, Napa County’s six unified and elementary districts went from 18,427 students in 2023-24 to 18,388 in 2025-26 — a loss of 39 students, or 0.21% over two years. The adjustment moves Napa from barely positive to slightly negative on a comparable basis with neighboring counties.
The parallel to Sonoma County is exact in direction and close in magnitude. Sonoma’s reported +0.34% became -0.19% after removing the Liberty Elementary charter authorizer’s statewide virtual enrollment. Napa’s reported +0.09% becomes -0.21% after removing NCOE’s specialized programs. Napa’s organic number, on this basis, is fractionally worse than Sonoma’s.
The ex-NCOE figure is the cleaner measure of what the regular district enrollment did. It answers the question most readers are asking when they read the headline: Did the unified and elementary districts hold ground? They did not. Napa, like its neighbors, lost ground organically over the past two years.

What’s Moving Beneath the Flat Line
A note on terms before the numbers. English Learner students are children whose home language is not English and who have not yet demonstrated English proficiency on California’s annual English Language Proficiency Assessments for California. Once a student tests as proficient, they are reclassified as Fluent English Proficient and move out of the EL category. EL enrollment in any given year is a snapshot of students currently receiving language-development services; it is not a measure of immigrant enrollment, which is a broader and separate concept that CDE does not directly publish. It is also distinct from racial or ethnic identity: Hispanic/Latino enrollment, which has been the largest racial/ethnic category in Napa County schools since the 2007 crossover, is not the same as EL enrollment. Most Hispanic/Latino K-12 students in California are English-proficient and not classified as EL. A county can see Hispanic/Latino enrollment hold while EL enrollment falls.
The headline number is a net of two larger underlying changes. Napa County’s English Learner enrollment fell from 4,439 students in 2023-24 to 3,865 in 2025-26 — a loss of 574 students, or 12.9%. In the same two years, non-EL enrollment rose from 14,133 to 14,723 — a gain of 590 students, or 4.2%. The +16 county headline is the residual of those two moves.
The EL contraction is distributed across the county. NVUSD lost 412 EL students (-10.5%) on a base of 3,914. St. Helena lost 30 (-19.1%) on a base of 157. Calistoga lost 115 (-42.8%) on a base of 269 — the steepest absolute drop. Howell Mountain lost 16 of 36; Pope Valley lost 9 of 19. NCOE was the only Napa district to gain EL students, adding 8 to reach 52.

The non-EL pattern runs the opposite direction. St. Helena’s +49 enrollment gain is entirely non-EL — the district added 79 non-EL students while losing 30 EL students. NVUSD’s near-flat -12 net is the residual of -412 EL students offset by approximately 400 non-EL students. The county’s stability is, in part, a recomposition.
The pattern extends across the immediate North Bay. Sonoma lost 1,470 EL students (-11.9%), Mendocino lost 310 (-12.6%), Marin lost 457 (-8.6%), Solano lost 537 (-6.4%). Lake County was the regional exception, adding 29. Napa’s 12.9% decline is the steepest in the region, but Sonoma and Mendocino are within a point. Whatever is happening is regional, with Napa modestly out front. The within-county distribution is sharper than the cross-county rate captures, however: Calistoga, Howell Mountain and Pope Valley all dropped more than 40% on their EL bases. The regional pattern is broadly similar across counties; Napa’s pattern is internally uneven in ways that matter for which districts are absorbing the change.
A contraction in EL enrollment can reflect two different kinds of change, and the distinction matters. One kind keeps students in the system but reclassifies them: an EL student who passes the ELPAC moves from EL to non-EL and is still enrolled. That mechanism reduces EL counts without reducing total enrollment. The other kind removes students from the system entirely: fewer immigrant families arriving with school-age children, intra-county or inter-district movement that takes EL students to other districts, or immigrant families with school-age children leaving the region. That mechanism reduces both EL counts and total enrollment. The Census Day data establishes the magnitude and the geographic distribution. It does not by itself distinguish between reclassification and departure as the underlying cause.

Where the Losses Are Sharpest: The Upvalley Pattern
Calistoga’s 42-student decline coincides with a moment when the city itself is gaining residents. Our recent, “Napa County Shrunk as Calistoga Grew and the Base Faltered,” documented Calistoga’s 120-resident gain — the largest percentage gain among Napa County jurisdictions — and traced it almost entirely to a single project: Lincoln Avenue Apartments, a 78-unit workforce-affordable complex at 1866 Lincoln Ave. that opened in late 2025. The school data offer a specific reading of what that mechanism produced. Calistoga Joint Unified lost 42 students during the same window in which the city it serves added 120 residents. The district’s English Learner enrollment fell from 269 students to 154 — a loss of 115 EL students, or 42.8%, the steepest EL contraction of any district in the county and the most pronounced two-year EL drop in the region. The 78 units filled. The district that serves them lost ground in the demographic group that has historically anchored its enrollment.

The article made the structural case that Calistoga’s affordable-housing apparatus is a workaround for a wage problem rather than a solution to a housing-supply problem — that the dominant local industry’s wages cannot support family formation at the cost of living in the town. The school data is consistent with that case, though it does not prove it. Workforce-affordable tenants on average skew toward service-sector adults whose household composition and household sizes vary widely from the family-with-school-age-children profile the school data register. The EL contraction in particular is the school-level signal of the same condition the population piece identified: The historical immigrant-family base that anchored Calistoga’s EL enrollment is being replaced, in net, by a different tenant base. The mechanism documented in the population piece is consistent with — though the school data do not by themselves establish — a generational shift in who is moving into Calistoga’s workforce-affordable units.
Howell Mountain Elementary and Pope Valley Union Elementary operate at scales where the enrollment figure is closer to a roster than a trend; the loss of 16 students at one and 18 at the other reflects individual family moves more than any structural shift. Across all three contracting Upvalley districts the combined two-year loss is 76 students, roughly two-thirds of which is offset by St. Helena’s +49 gain and the remainder absorbed at the level of the county number by NVUSD’s near-flat result. The county arithmetic resolves to a result close to zero, but the geographic distribution is real: the Upvalley districts are contracting, Downvalley is holding, and the rural east is at the floor of what the data can register.

What This Leaves Open
The Census Day release captures composition but not direction of cause. The 574 EL students who left Napa County’s rolls between 2023-24 and 2025-26 are a measurable population. Why they left — or whether they left, as opposed to being reclassified — is not established by the enrollment file alone.
A note on scope. All public-school figures in this piece come from CDE’s Census Day release. Private and parochial schools are reported separately through California’s Private School Affidavit program — a self-reported, voluntary filing whose completeness varies year to year. For the overlap window (2019-20 through 2024-25), Napa County’s private K-12 enrollment held essentially flat at roughly 2,500-2,600 students, a 3% gain on a small base. Public enrollment over the same window fell by 1,437. The combined public-plus-private decline is roughly 6% over five years. Private enrollment did not absorb the public decline — the demographic curve underneath both is the cleaner explanation. Homeschooling and learning pods are not captured in either data series and remain an unmeasured residual.
Three additional questions remain open at this writing. The NCOE +55 includes some component of student movement from home districts to specialized settings; the share of that figure that represents organic program growth versus reclassification of students previously counted elsewhere is not resolvable from CDE data. The May 1 California Department of Finance E-1 population estimates for Napa County’s jurisdictions provide the population context against which the enrollment picture should be read; those figures are pulled separately. And the DOF E-4 historical series anchors Napa County’s 2015 peak at approximately 141,530 residents — a benchmark the current series can be measured against.
A fourth question worth flagging is the relationship between the EL contraction and broader state-level immigration dynamics. The May California Department of Finance E-1 release attributed California’s population decline this year specifically to federal immigration policy changes — legal international migration cut by more than half compared to the prior year, an effect the DOF release named explicitly. Whether and how that state-level dynamic shows up in Napa County school data is a question the Census Day file alone cannot resolve, and the CDE reclassification dataset that would help distinguish students leaving the system from students reclassifying within it has not been published for years more recent than 2020-21. The composition of the 574-student EL decline is the natural follow-on inquiry for the 2026-27 release and beyond once more recent reclassification data becomes available.

The 2026-27 Release Will Tell Us Which Line Moves
Three lines are currently in tension in the Napa data. Napa Valley Unified is holding flat through a recomposition that has the same magnitude in each direction. St. Helena Unified is gaining ground in a slice of the county where families with means continue to locate. The three Upvalley districts are contracting on a base of small numbers and a shrinking EL population.
Underneath all three is a regional birth curve that has been contracting for two decades, with Napa marginally leading the contraction. Looking backward from 2025-26, the longer arc is unmistakable: Napa County’s public K-12 enrollment peaked at 21,002 in 2014-15 and has lost roughly 2,400 students over the 11 years since, an 11.5% decline. Underneath that total, the demographic composition has reversed — white and Hispanic/Latino enrollment crossed in 2007, and by 2020-21 Hispanic/Latino students outnumbered white students more than two to one. The recent two-year flat result sits at the bottom of that long decline, not in the middle of it.

The question for the next release is which of the three lines moves first. NVUSD’s flat trajectory survives one more year of EL contraction only if the non-EL gain keeps offsetting it. St. Helena’s +4.44% gain survives only if the families locating to the Upvalley keep choosing it. The Upvalley contraction continues unless something arrests it. The release in April 2027 will tell us which of those three is the most brittle.
—
Tim Carl is a Napa Valley-based photojournalist.
Today’s Polls:
Recent Poll Results:
Text
The Economy:
NEW: Visit our new Community Dashboard to get the most up-to-date information.
Economic Pulse Indicators Local:
Key Local Takeaways:
Napa County’s unemployment rate was down in March to 4.3%.
Winery license issuance is largely flat after the biggest drop in history.
Napa home values remain down, sales are largely flat MoM.
The Local Data:
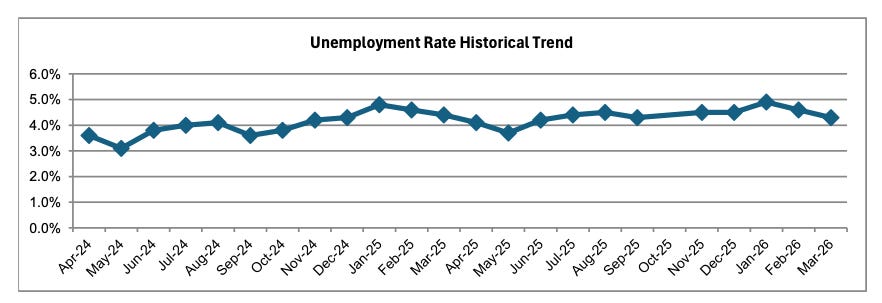
The unemployment rate in Napa County was 4.3% in March, down from a revised 4.6% in February and below the year-ago estimate of 4.4%. This compares with an unadjusted unemployment rate of 5.2% for California and 4.3% for the nation during the same period. (Source)
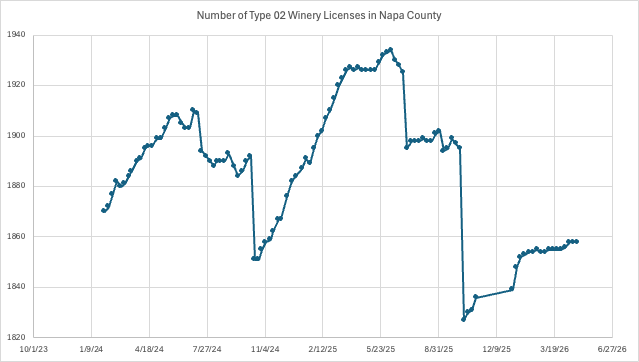
As of May 17, Napa County had 1,859 Type-02 winery licenses, which was up one from last week. (Source)
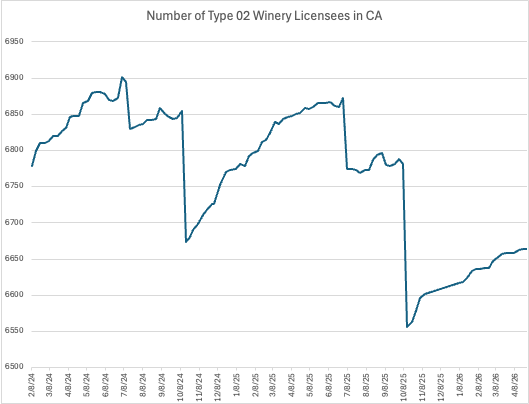
As of May 17, California has 6,680 Type-02 winery licenses, which was up eight from last week. (Source)
Napa County’s civilian labor force fell about 4.1% year over year, declining from roughly 75,100 in January 2025 to 72,000 in January 2026, remaining well below its October 2008 peak of 79,289 and above its January 1991 low of 54,355. (Source)
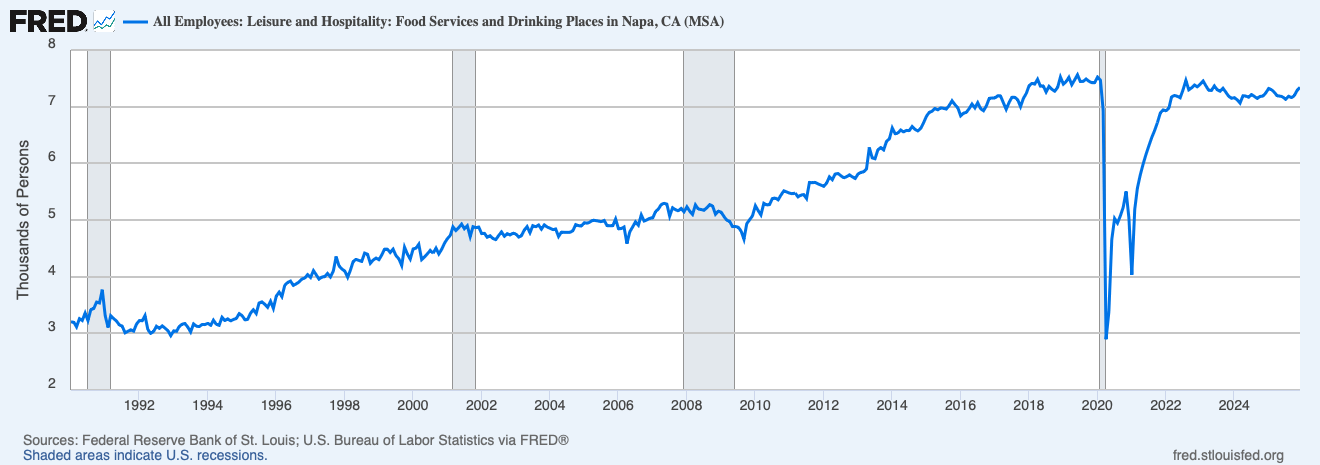
Employment in Napa County’s food services and drinking places sector was about 7,339 in December 2025, roughly 3% below the June 2019 peak of 7,589. (Source)
As of May 17, the average Napa County home value is $893,351, which is down 3.2% year over year, while homes go pending in 37 days. (Source)
Visuals That Caught Our Eye:

An article in The Independent reports that rising diesel prices caused by the Iran war and Strait of Hormuz disruptions could have a greater economic impact than gasoline prices because diesel fuels trucks, farming equipment and heavy industry. (Source)

Global oil demand is forecast to contract by 420 kb/d year over year in 2026 as the Middle East conflict and Strait of Hormuz disruptions drive supply shortages, refinery cutbacks, higher prices and weaker economic growth worldwide. (Source)
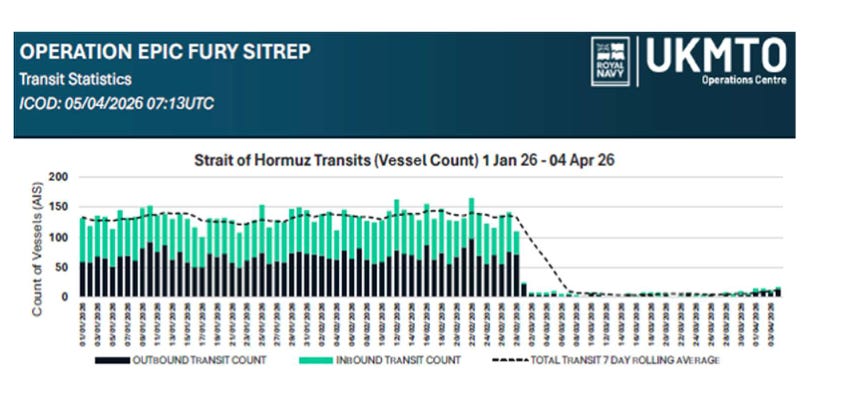
The Joint Maritime Information Center Advisory Note dated April 5, which tracks maritime security incidents in the Middle East. Since Jan. 1, 2025, JMIC documented 169 total incidents, excluding coalition engagements, with 14 incidents in April alone, primarily concentrated in the Arabian Gulf/Strait of Hormuz region where the threat level remained at CRITICAL. (Source)
Explore These Related Articles:


Browse All Napa Valley Features Stories
Browse All Sonoma County Features Stories
Browse All Lake County Features Stories
—
The views, opinions and data presented in this article are those of the author and do not necessarily reflect the official policy, position or perspective of Napa Valley Features or its editorial team. Any content provided by our authors is their own and is not intended to malign any group, organization, company or individual.